This web page was produced as an assignment for Genetics 564, an undergraduate course at UW-Madison.
protein phylogeny
Phylogeny, used to construct phylogenetic trees as seen below, is an essential component of tracing lineages over time: DNA, genes or proteins. Whilst simple in concept, constructing a phylogenetic tree requires several steps and programs to complete, such as ClustalW2 and ClustalWOmega, a series of databases used to align various protein sequences and construct trees through means of percent identity, BLOSUM62, neighbor joining and average distance--described below:
Percent Identity- identifies how identical two sequences are at specific base pairs, then can align them through either neighbor joining or average distance to construct the phylogenetic tree [1].
BLOSUM62- an algorithm based calculation of how similar two sequences are at specific amino acids, and how likely it is that they will continue to be similar across a sequence. Once constructed, BLOSUM62 can organize via neighbor joining or average distance to construct the necessary phylogenetic tree [1].
Neighbor Joining- takes the similarity scores based on either percent identity or BLOSUM62 and aligns them to determine which species are most closely related. From here, neighbor joining adjusts the branch lengths to account for when the protein (in this case) diverged from one another. Branches here are different lengths [1].
Average Distance- Similar to neighbor joining of establishing which species are most closely related, average distance adjusts branch lengths to remain the same, assuming equal divergence from a common ancestor [1].
phylogenetic trees
Below are the phylogenetic trees constructed using the various means described above. Of those established, the tree chosen to be most ideal was the one constructed using percent identity and average distance. Seen below, it grouped the various organisms and species together to illustrate how PSEN1 could be traced to a common ancestor. Noting the important nodes, or where the tree diverges, it is observable that organisms with similar ancestry were grouped more closely together.
Despite this, the other trees were proven useful in reassuring how PSEN1 diverged over time, but also illustrating a possibility as to how this divergence occurred. Knowing that none of these phylogenetic trees can be proven to be 100% accurate, it is important to comprehend the other phylogenetic trees constructed, seen below:
Despite this, the other trees were proven useful in reassuring how PSEN1 diverged over time, but also illustrating a possibility as to how this divergence occurred. Knowing that none of these phylogenetic trees can be proven to be 100% accurate, it is important to comprehend the other phylogenetic trees constructed, seen below:
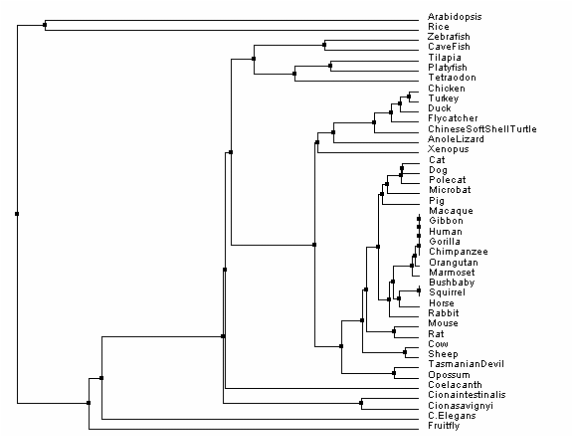
Figure 1. Constructed using % identity and average distance. Chosen as the ideal phylogenetic tree.
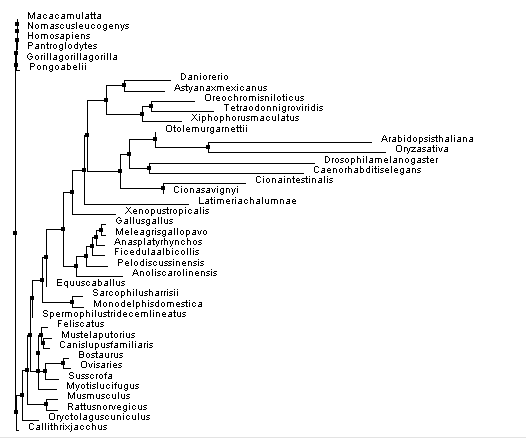
Figure 2. Constructed using % identity and neighbor joining.
|
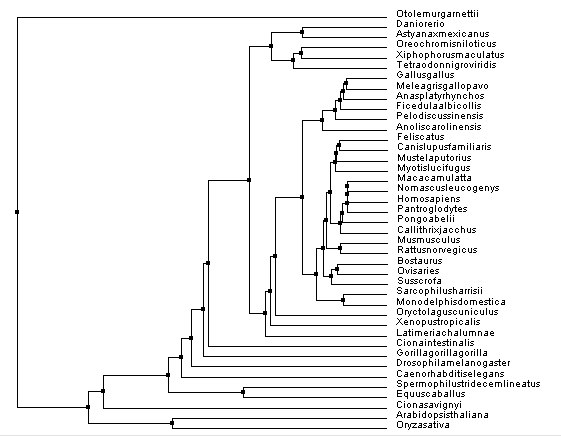
Figure 3. Constructed using BLOSUM62 and average distance.
|
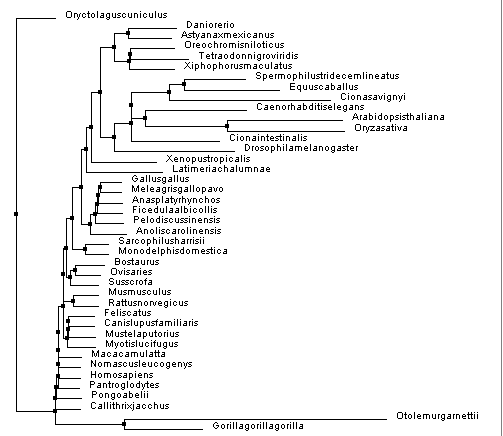
Figure 4. Constructed using BLOSUM62 and neighbor joining.
discussion
Mentioned above, each phylogenetic tree is important to understanding where and when PSEN1 diverged in history. Of the four options, the tree constructed using percent identity and average distance appears to the be the most useful toward Alzheimer's research, as it interprets PSEN1 to have diverged or been found in humans and other mammals after appearing in rice, Arabidopsis and C. elegans, which would make sense given the timeline in Homo sapiens history. The neighbor joining phylogenetic trees fail to address this. In choosing between the BLOSUM62 matrix or percent identity, I believed the percent identity to best illustrate PSEN1 phylogeny, as the BLOSUM62 grouped species in a manner slightly less in accordance with human history.
REFERENCES
